Introduction
Key metrics allows you to tailor your Site Kit dashboard to show the top metrics most relevant to your site’s goals. You can answer three simple questions to get a suggested list of metrics, or select your own metrics. If you have any suggestions for future metrics for Site Kit, feel free to share them via the Site Kit support forum.
Setup
Key metrics can be set up from the admin settings (Site Kit > Settings > Admin Settings).
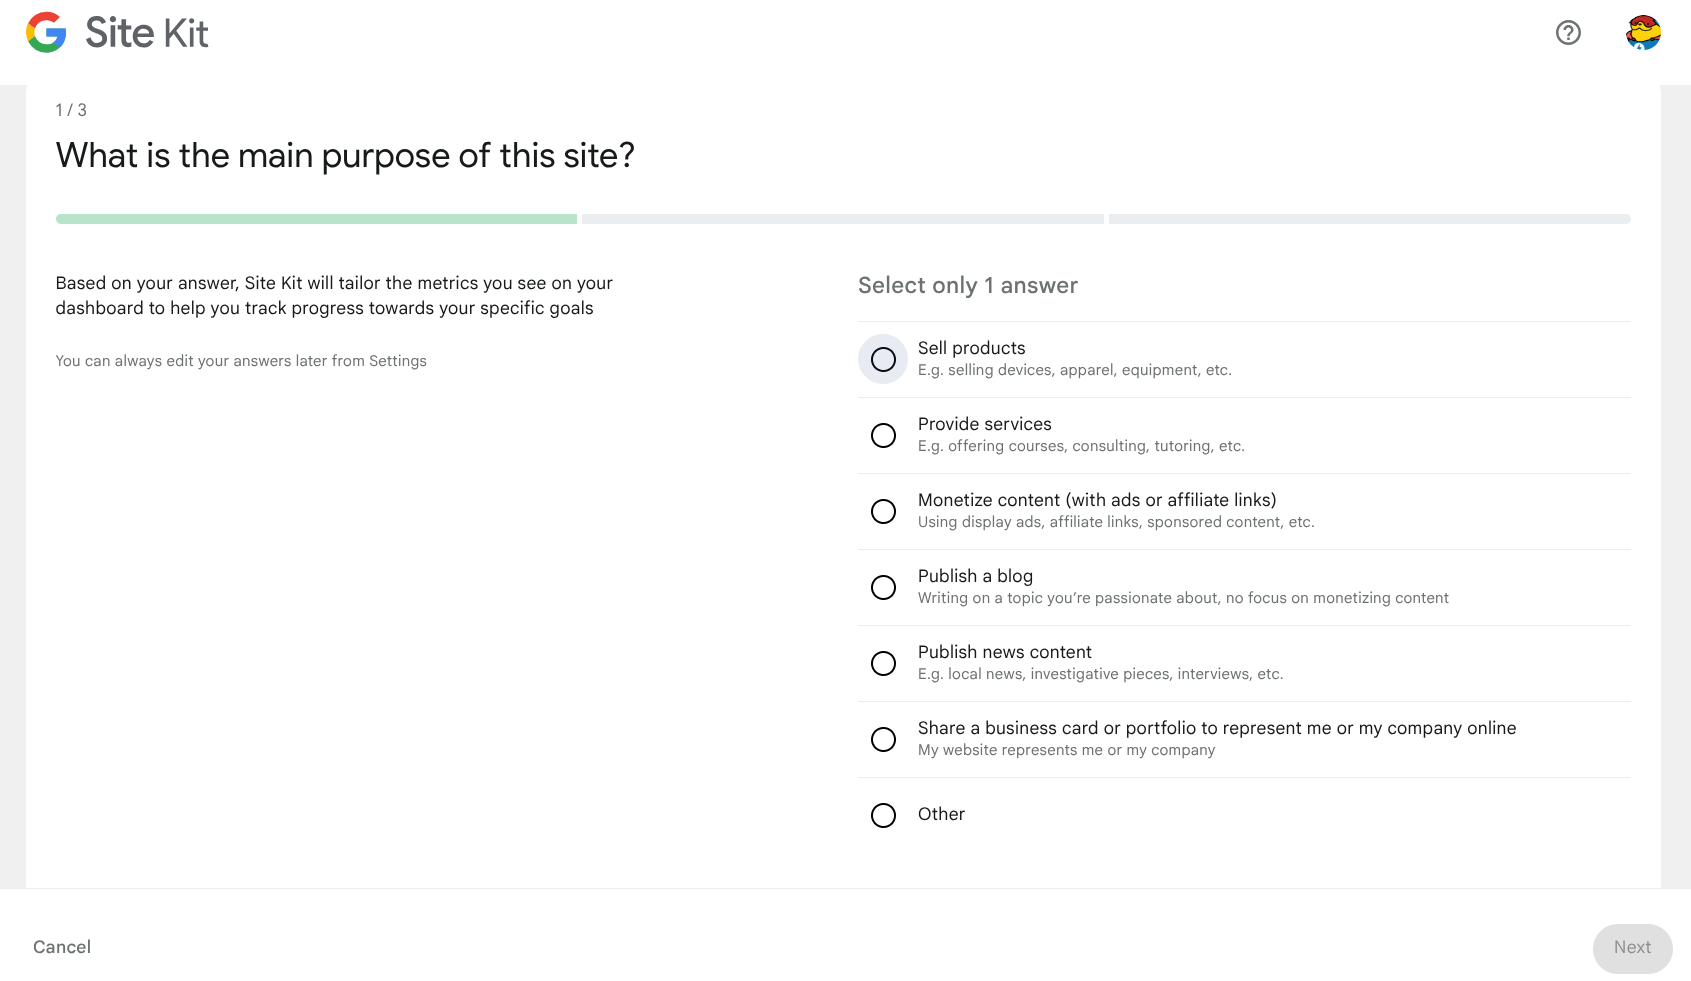
To get tailored metrics selected for you by Site Kit, you need to answer three questions to help Site Kit better understand your site’s goals. If you want to select your own metrics, you can make your own selection.
The first question asks about the main purpose of your site. You can select only one answer for this question before selecting the Next button to progress.

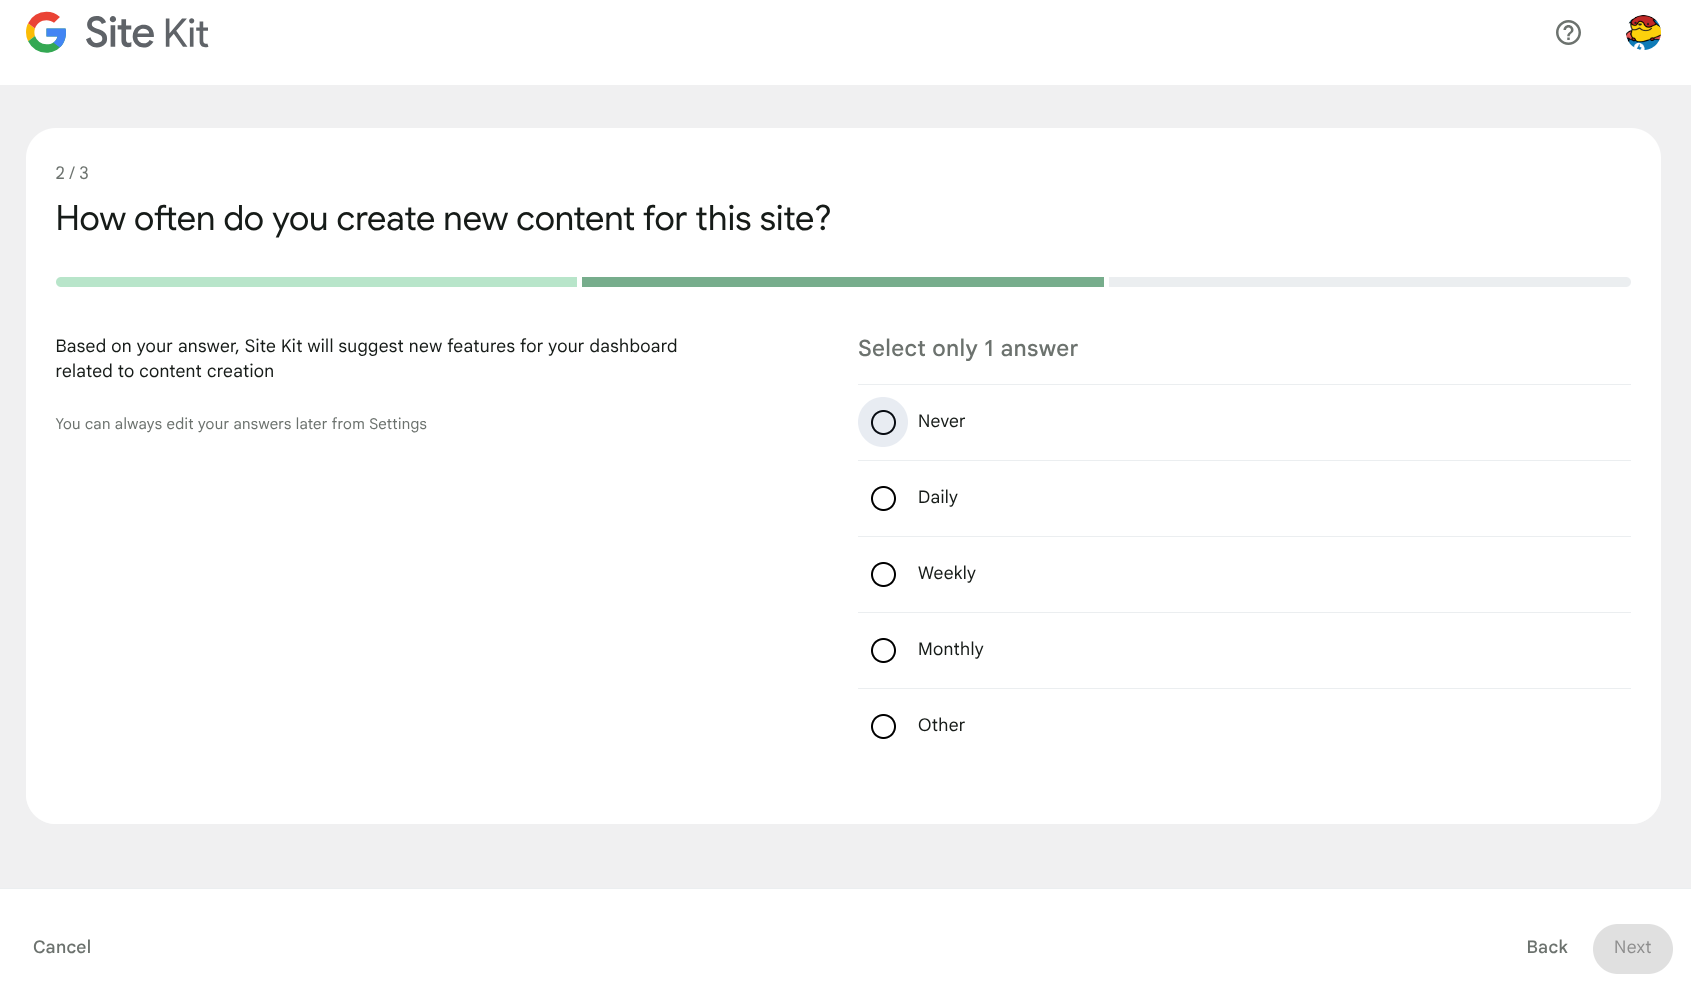
Question two seeks to find out how often you create new content for your site. You can select only one answer for this question before selecting the Next button to progress. You can also choose to return to question one if you wish to change your answer by clicking on the Back button.
The third and final question asks what the top goals for your site are. You can select up to three answers for this question with a minimum of one needed to progress. You can also choose to return to question two if you wish to change your answer by clicking on the Back button.

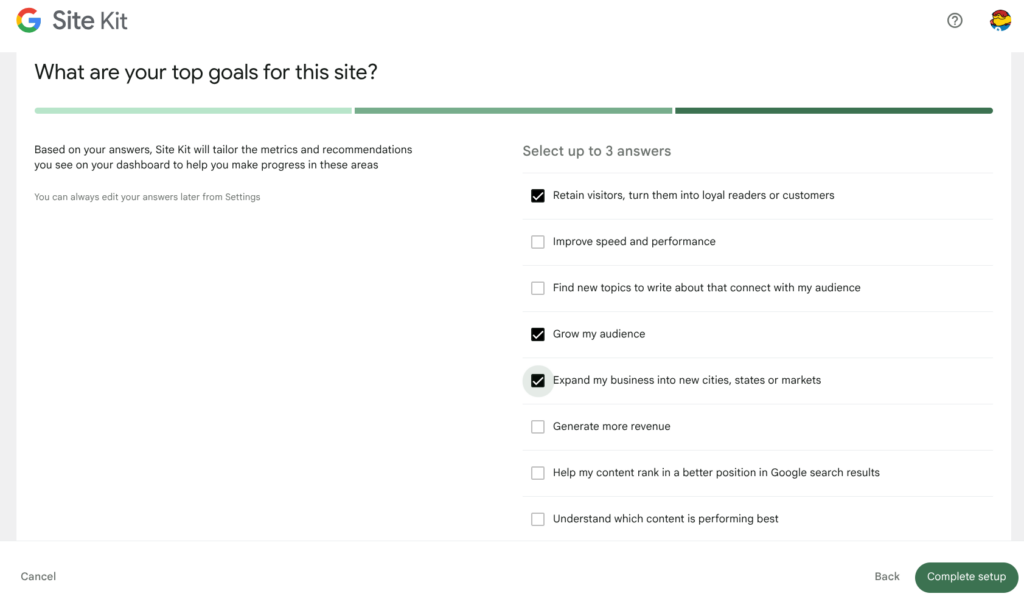
Once you have answered all of the questions, click on the Save button. You can also choose to go back to the question setup workflow by clicking on the Back button, which takes you back to question three.
Once saved, you are directed back to the Site Kit dashboard, where you see the key metrics section at the top of the dashboard populated with tiles. These tiles display suggested metrics that are relevant to your site based on your responses to the three questions. If you select ‘Other’ for your answers, you see a default set of metrics. These metrics can be changed by clicking Select Metrics.

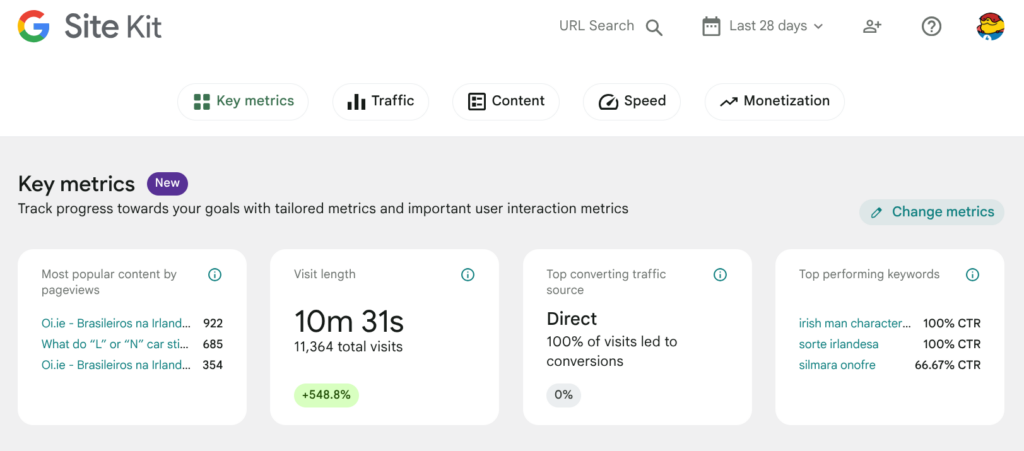
Selecting Change Metrics displays the metrics selection panel. This panel allows you to change the metrics displayed on your Site Kit dashboard with any of the other available metrics, up to a maximum of 8.

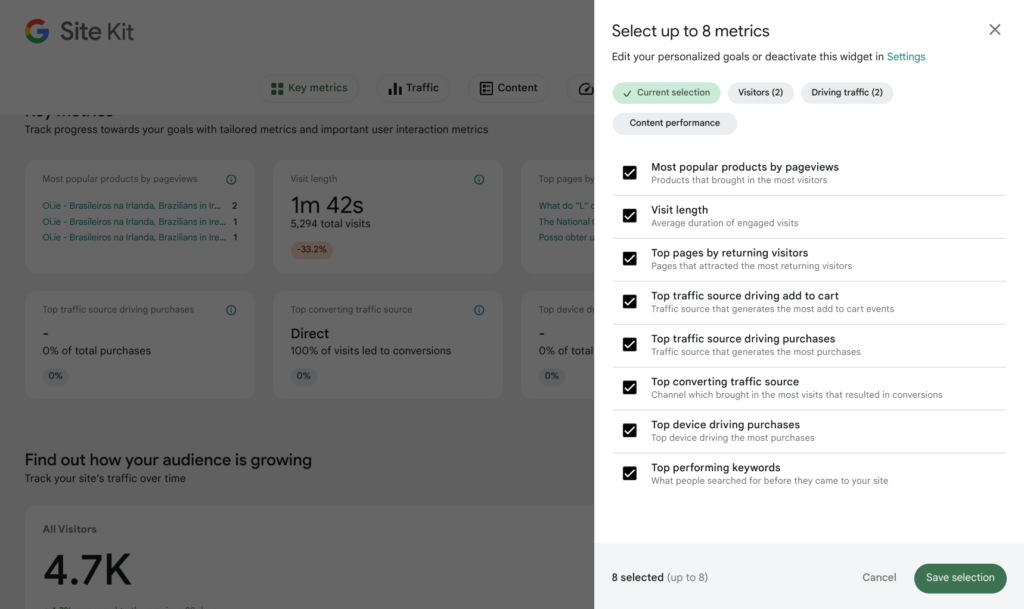
Key metrics are grouped to help you find the right metrics for your site. These groups include visitors, driving traffic and content performance.
If you opt to have tailored metrics, you see a Suggested group which contains a list of suggested metrics based on the answers given in the questionnaire.
You can select a maximum of eight metrics and a minimum of two. You can also find a shortcut to the Site Kit settings, where you can set up tailored metrics if you haven’t done so, allowing you to edit your personalized goals as well as an option to remove key metrics from the dashboard altogether.
Once you have selected the metrics you wish to use, click on the Save Selection button. If you wish to keep your current metrics, select Cancel.
If you don’t choose to use the maximum number of key metrics (8), you may see some tiles on the dashboard with an Add a metric option. Clicking on these opens the metrics selection panel, allowing you to select additional metrics for the remaining unused tiles.
New key metrics
New metrics may become available to you if new Analytics conversion events are detected. A banner notification appears when these new metrics are detected within your connected Google Analytics property. Click on the Add metrics button to add these new metrics options for your site.
Unavailable metrics data
If Site Kit can no longer detect event data for any of your selected metrics over the maximum reporting time period of 90 days, you see an Unavailable metrics data notification. This is because some of the selected metrics no longer have any event data within the maximum reporting time period of 90 days.
This could be because you have recently connected a new Analytics property with no previous event data, Analytics data for the connected property is still being gathered or conversion events are no longer being triggered.
Key metrics and custom dimensions
Some key metrics tiles require the creation of custom dimensions within your site’s associated Analytics property. These metrics are not measured in Analytics by default, but Site Kit can track them for you by creating custom dimensions, including:
- Top recent trending pages
- Top categories by pageviews
- Most popular authors by pageviews
- Most popular products by pageviews
If the required custom dimensions do not exist when choosing one of these metrics from the selection panel, you see a notice explaining that the metric selected requires more data tracking. This notice also explains that Site Kit updates your Analytics property on your behalf after you save your selection. Click on the Apply changes button to proceed.
To grant the necessary permissions for Site Kit to create the necessary custom dimension(s), select the Google account associated with the connected Analytics property.
Select Continue to grant the necessary additional access to your Google account to create the custom dimension(s).
Once permission is granted, you are returned to the Site Kit dashboard with your newly selected key metric displayed.
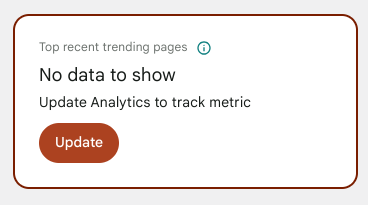
NOTE: Data only begins to be tracked and populated after the required associated custom dimensions have been created. As a result, you may not initially see data in the associated tiles if the custom dimensions were recently created or were created for you by Site Kit.
If you choose not to grant the necessary permissions to create the required custom dimension(s), you are returned to the dashboard and see the selected tile with a “No data to show” message. Click on Update to select your Google account and grant the permissions. You can also choose to remove or replace the metric from the selection panel.

Key metric tiles
The table below explains each key metric tile in more detail.
| Metric title | Metric description | Screenshot Example |
|---|---|---|
| Least engaging pages | Pages with the highest percentage of visitors that left without engagement with your site Data source: Analytics |  |
| Returning visitors | Portion of people who visited your site more than once Data source: Analytics |  |
| Most engaged traffic source | Visitors coming via this channel spent the most time on your site Data source: Analytics |  |
| Most engaging pages | Pages with the highest engagement rate Data source: Analytics |  |
| Most popular authors by pageviews | Authors whose posts got the most visits Note: This metric requires custom dimensions Data source: Analytics |  |
| Most popular content by pageviews | Pages that brought in the most visitors Data source: Analytics |  |
| Most popular products by pageviews | Products that brought in the most visitors Data source: Analytics (requires the site to have a product post type) |  |
| New visitors | How many new visitors you got and how the overall audience changed Data source: Analytics |  |
| Pages per visit | Number of pages visitors viewed per session on average Data source: Analytics |  |
| Top pages by returning visitors | Pages that attracted the most returning visitors Data source: Analytics |  |
| Top categories by pageviews | Categories from your site visitors viewed the most Note: This metric requires custom dimensions Data source: Analytics |  |
| Top performing keywords | What people searched for before they came to your site Data source: Search Console |  |
| Top recent trending pages | Pages with the most pageviews published in the last 3 days Note: This metric requires custom dimensions Data source: Analytics |  |
| Top cities driving traffic | Which cities you get the most visitors from Data source: Analytics |  |
| Top converting traffic source | Channel which brought in the most visits that resulted in conversions Data source: Analytics |  |
| Top countries driving traffic | Which countries you get the most visitors from Data source: Analytics |  |
| Top traffic source | Channel which brought in the most visitors to your site Data source: Analytics |  |
| Visit length | Average duration of engaged visits Data source: Analytics |  |
| Visits per visitor | Average number of sessions per site visitor Data source: Analytics |  |
| Top earning pages | Pages that generated the most AdSense revenue Data source: Analytics & AdSense. These need to be linked. | 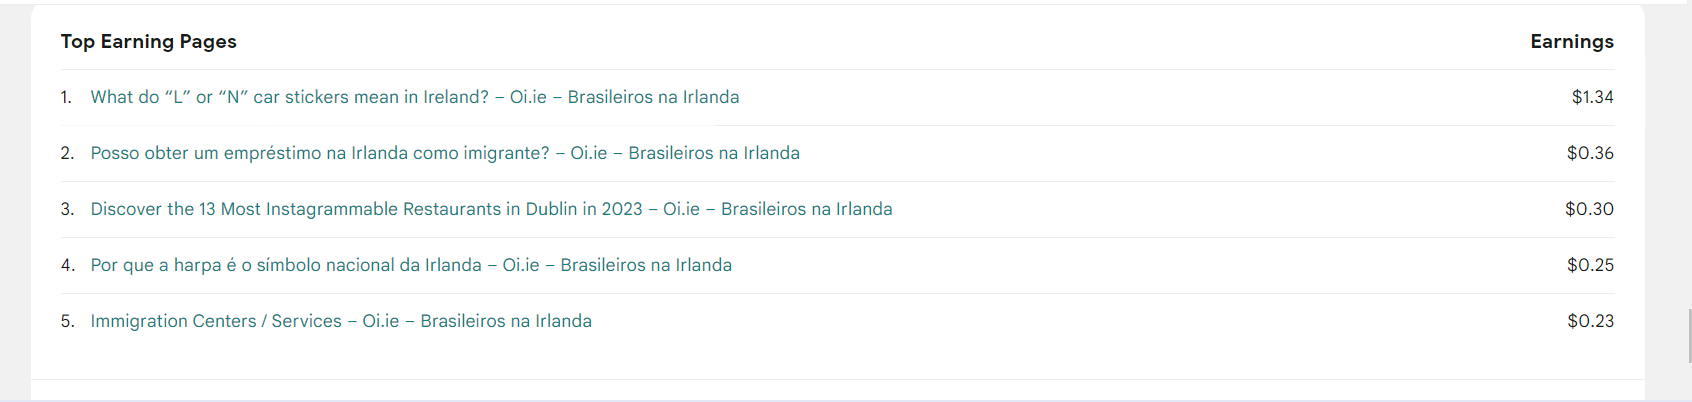 |
| Top pages driving leads | Pages on which forms are most frequently submitted Requires plugin conversion tracking to be enabled for Analytics Data source: Analytics |  |
| Top cities driving leads | Cities driving the most contact form submissions Requires plugin conversion tracking to be enabled for Analytics Data source: Analytics | 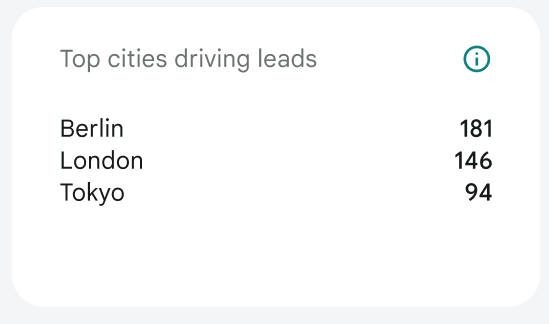 |
| Top traffic source driving leads | Total number of leads for the top traffic source Requires plugin conversion tracking to be enabled for Analytics Data source: Analytics |  |
| Top cities driving add to cart | Cities where visitors most frequently add products to their carts Requires plugin conversion tracking to be enabled for Analytics Data source: Analytics | 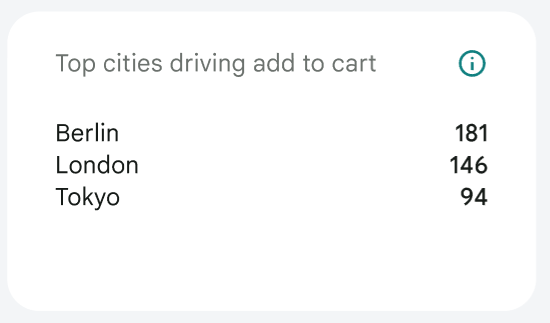 |
| Top traffic source driving add to cart | Traffic source that generates the most add to cart events Requires plugin conversion tracking to be enabled for Analytics Data source: Analytics |  |
| Top cities driving purchases | Cities driving the most purchases Requires plugin conversion tracking to be enabled for Analytics Data source: Analytics |  |
| Top device driving purchases | Top device driving the most purchases Requires plugin conversion tracking to be enabled for Analytics Data source: Analytics | 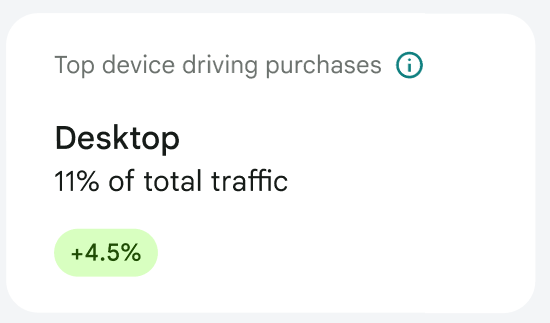 |
| Top traffic source driving purchases | Traffic source that generates the most purchases Requires plugin conversion tracking to be enabled for Analytics Data source: Analytics | 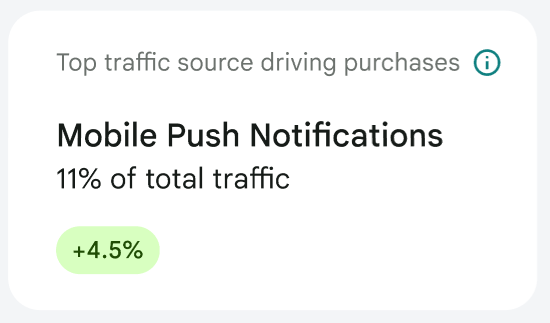 |


Comparing metrics
Total users vs. active users
Most of the key metrics are calculated using the totalUsers metric in Google Analytics. The Returning visitors and New Visitors metrics, however, are calculated based upon the activeUsers metric, which is the primary user metric for Google Analytics 4. This difference could result in minor discrepancies between the data that you see in the Site Kit dashboard compared to the data in your Google Analytics dashboard. More details on the differences between totalUsers vs activeUsers are available in this Google Analytics guide.
In addition, Site Kit shows all users, including any who were not engaged, while Google Analytics shows only the engaged users by default. This is explained further in the [UA→GA4] Comparing metrics: Google Analytics 4 vs. Universal Analytics guide.
New vs. returning visitors
New visitors are users that are navigating to your site for the first time on a specific device. Returning visitors are users that have visited your site before.
When viewing your metrics, new visitors plus returning visitors are likely not equal total visitors This is because it is common for a single visitor to visit a site multiple times depending on the length of the reporting period, meaning the visitor is “counted” as both new and returning.
The higher the total of new plus returning visitors, the more return sessions your visitors are making. If the number of new plus returning visitors for your site is similar to your number of total visitors, it means that most of your visitors have only one session with your site. If you have any questions about the metrics displayed in Site Kit, please open a support topic in the Site Kit forum.
Plugin conversion tracking metrics
Some key metrics require you to have plugin conversion tracking enabled within Site Kit in order for them to appear within the Key metrics dashboard area and within the metric selection panel. These metrics are highlighted in the key metrics table above. Find more information on plugin conversion tracking.
Disconnecting Analytics
Most key metrics tiles require Analytics to be connected. If Analytics is disconnected, the “Google Analytics is disconnected” message is displayed. You can reconnect Analytics using the Connect Google Analytics button.
When Analytics is disconnected, the Key metrics section on the Site Kit dashboard still displays new key metric tile(s) that do not require Analytics data, alongside the Analytics is disconnected message. You can reconnect Analytics using the Connect Analytics button.
If you try to change metrics after disconnecting Analytics, all metrics listed in the selection panel that require Analytics show an ‘Analytics is disconnected, no data to show’ message. Additionally, any metric listed in the selection panel that requires Analytics and was not already pre-selected will not be selectable until Analytics is re-connected.
Settings
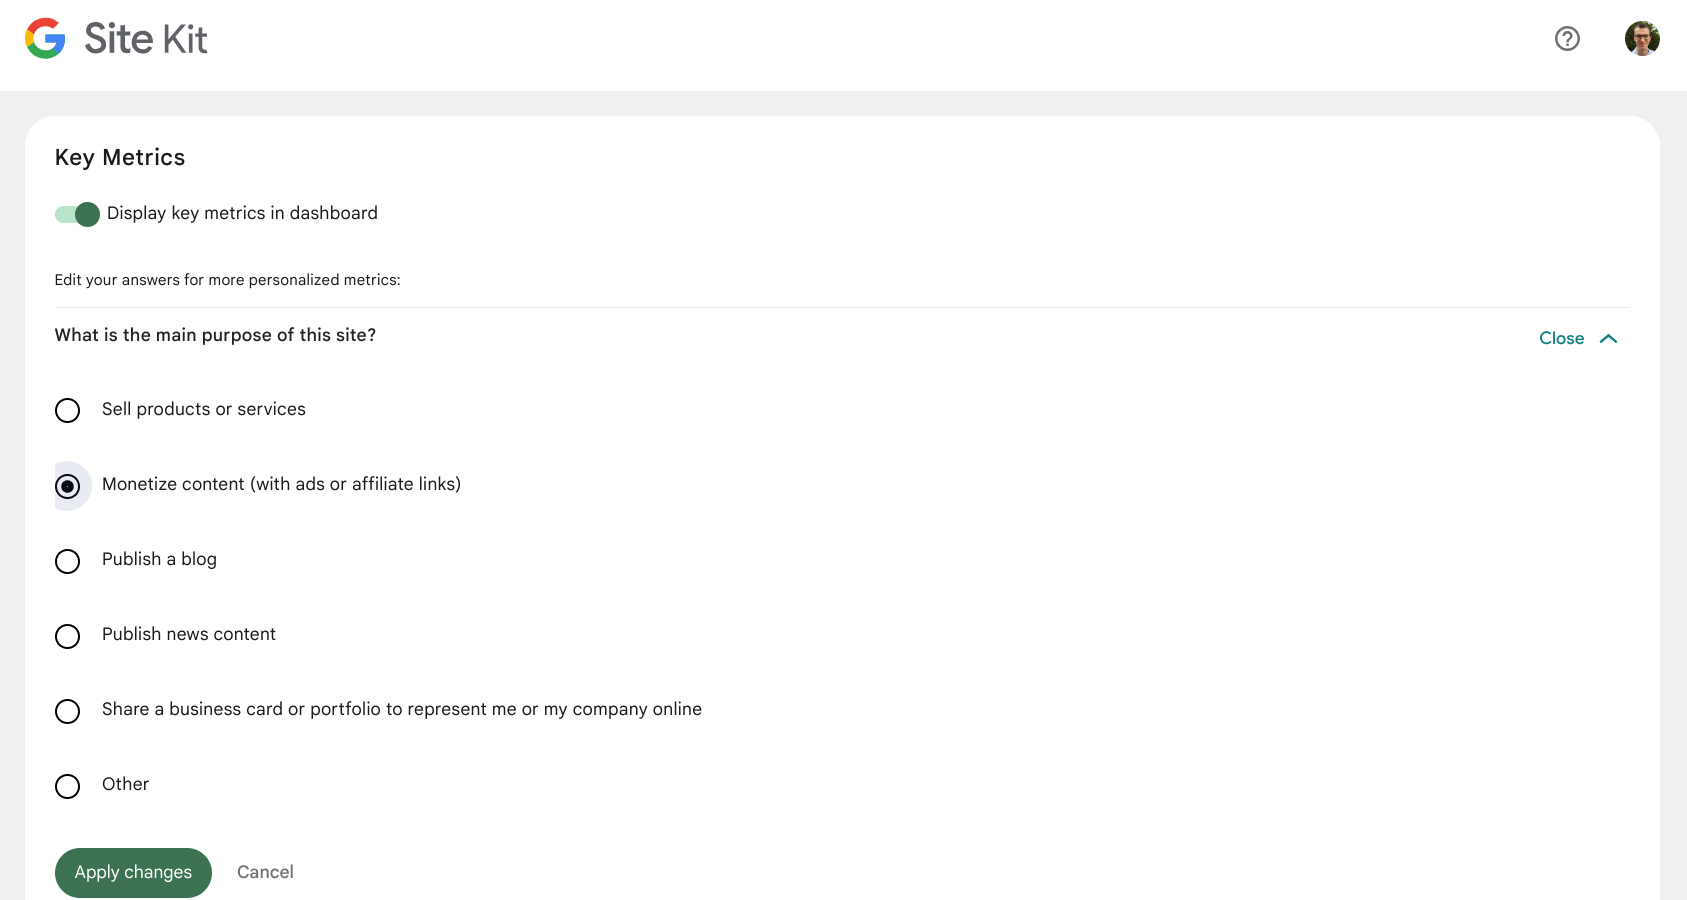
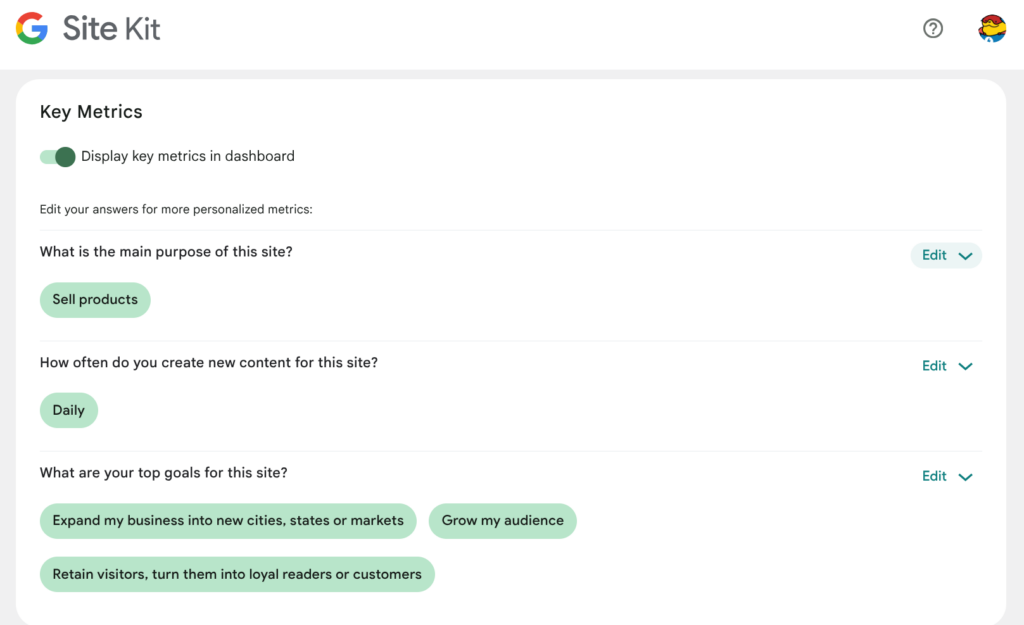
Once metrics have been configured, a toggle to turn on/off the display of key metrics in the dashboard becomes available in Admin Settings. Switching the toggle off removes the key metrics section from the dashboard. You can display your key metrics once more by switching the toggle on.
After setup, you can also see the three questions and answers you provided for the key metrics setup here.

If you completed the key metrics questionnaire prior to Site Kit 1.141.0 and you selected the Sell products or services option for question 1, you can see the following notice when next viewing your key metrics questionnaire answers.
This explains that the answer previously selected by you has since been split into two separate answers and it is advised that you update your answer for better accuracy. Click on Got it to clear the notice.
To edit a question, click on the Edit dropdown button for that question. If you are editing question 1, you can see who the question was answered by. Question 1 is site-wide and answering question 1 changes the response for all users of the site. When changing your answer to question 1, you get a Tailored metric selections pop up.
You can choose to keep your current selection of metrics or select the new suggested metrics by clicking on Update metrics selection.
Answers to questions 2 and 3 are specific to the user. The responses for these questions are stored per user and changing them does not affect other users.
Once you have changed your answer(s), click on the Apply Changes button or Cancel to cancel editing without saving any changes.