- Overview
- Key metrics
- Traffic
- Site goals
- Content
- Speed
- Monetization
- Gathering data
- Not enough traffic yet to display stats
Overview
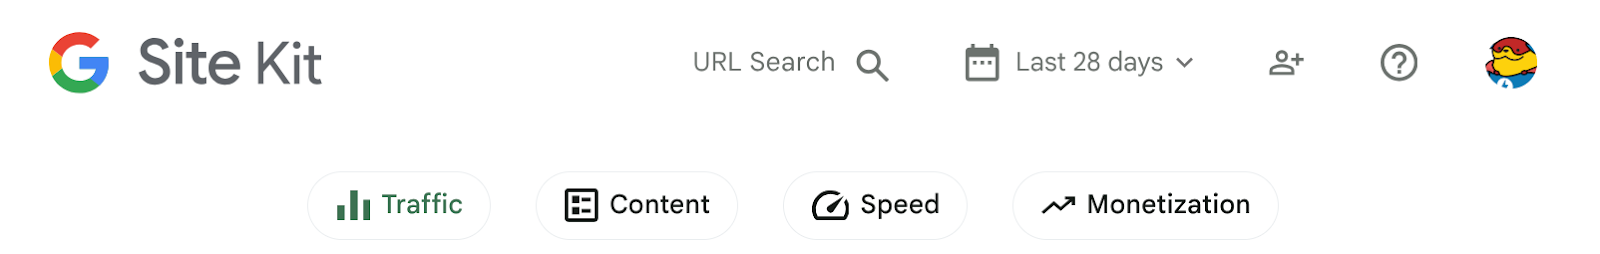
The Site Kit dashboard makes it easy to view and access relevant metrics from across multiple Google services all in one place. Metrics are combined into sections - Traffic, Content, Speed, and Monetization - so that you can see how your site is performing in each of these key areas. Each section can be reached using the tabs at the top of the dashboard.

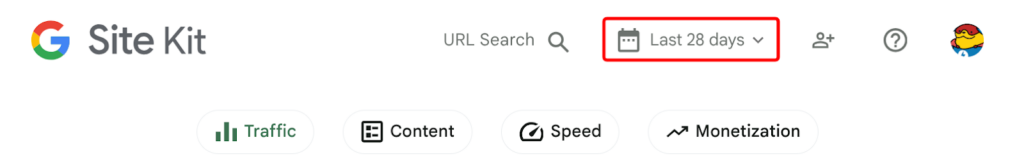
By default, metrics are calculated and displayed for the last 28 days, but you can use the calendar dropdown to change to the last 7, 14, or 90 days instead.

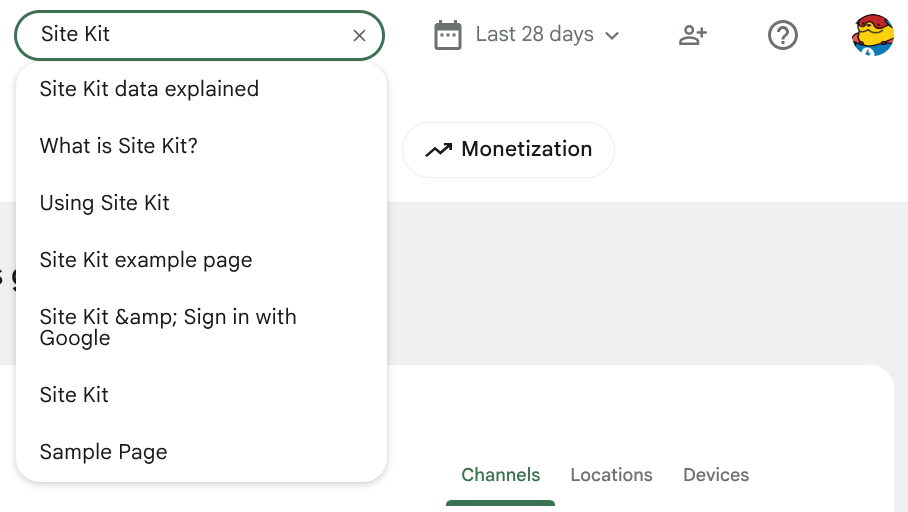
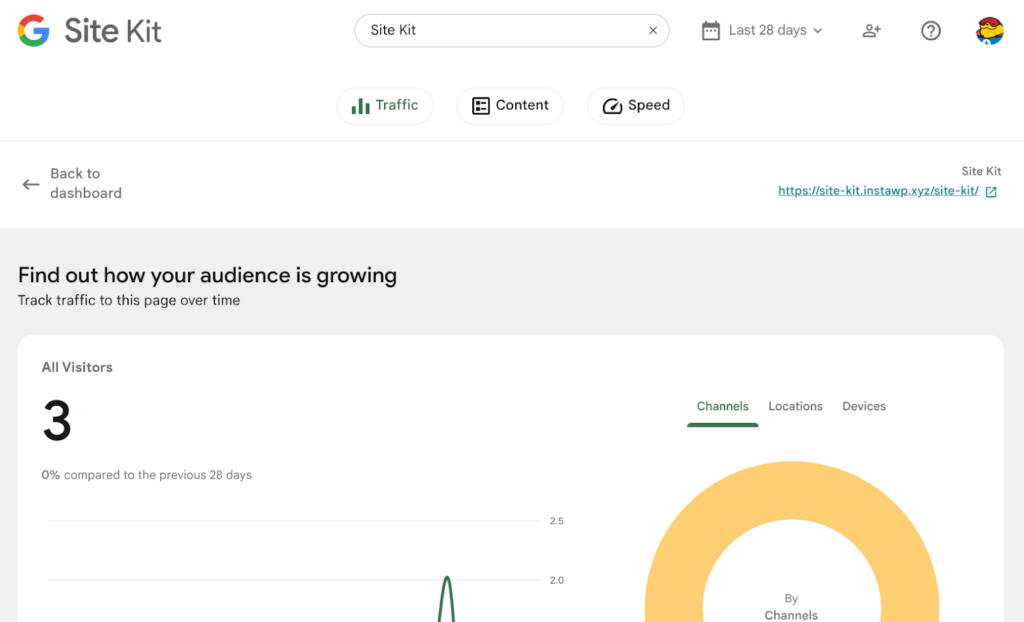
The URL Search at the top of the Site Kit dashboard allows users to view dashboard metrics for one specific URL. Typing in this box conducts a search of all of your site’s pages and posts and auto-suggests one based upon your input.

When Analytics is disconnected, the Key metrics widget on the Site Kit dashboard still displays new key metric tile(s) that do not require Analytics data, alongside the Google Analytics is disconnected message. You can reconnect Analytics using the Connect Analytics button. To go back to the main Site Kit dashboard with data displayed for all site URLs, select Back to dashboard at the top of the screen.

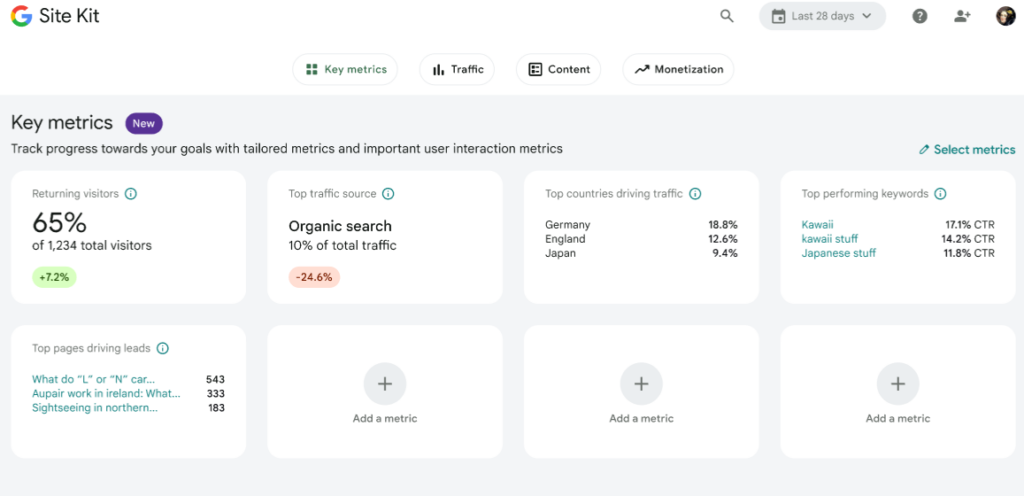
Key metrics
The Key metrics section allows you to view up to 8 key metric widgets at the top of your dashboard. These metrics can be added and removed to best suit your requirements, allowing you to see the most relevant metrics for your website. When viewing your metrics, new visitors plus returning visitors will likely not equal total visitors. This is because it is common for a single visitor to visit a site multiple times depending on the length of the reporting period, meaning the visitor will be “counted” as both new and returning. Key metrics can either be manually curated by you or automatically tailored by Site Kit based on your site’s purpose.

Find more information on Key metrics.
Traffic
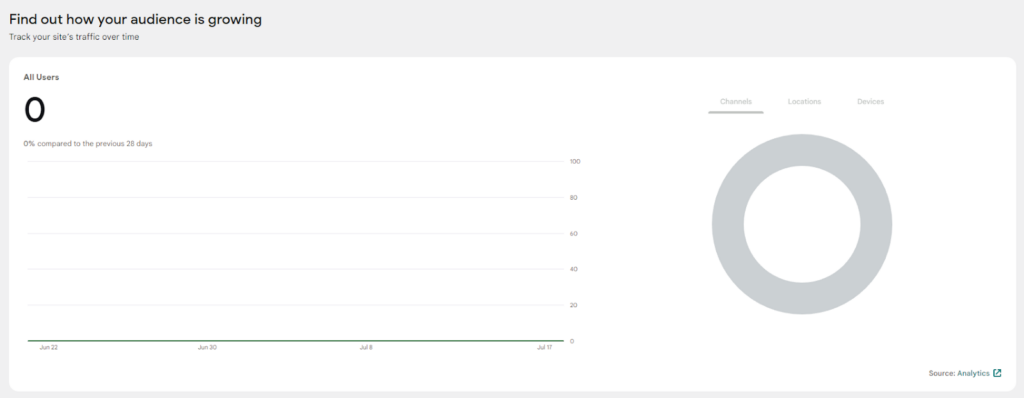
The Traffic section helps you understand how many visitors are coming to your site and how they discovered your site.

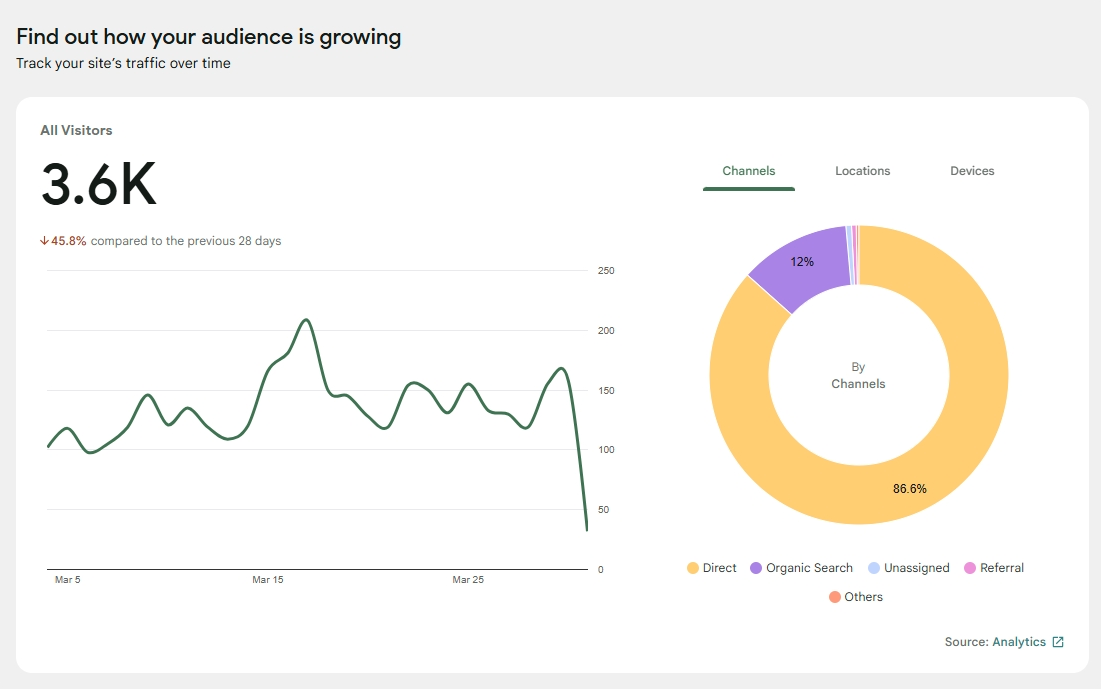
The left line graph shows the number of unique visitors to your site during the time period selected from the calendar dropdown. This data comes from Analytics. The right pie chart shows the breakdown of site visits during this period based upon how visitors found your site using the following metrics:
| Channels | How people discovered your site. Here are some of the most common channels: Referral: People who found your site from a link on another website. This means other sites are linking to your site, and it’s a good idea to check who is linking to your site in Google Search Console. Organic Search: People who found your site from a search engine. Organic Social: Any social media activity without a paid promotion. Direct: People who typed your site URL directly into their browser, or who bookmarked your site. Unassigned: Analytics doesn’t know where the traffic is coming from. If you try to change metrics after disconnecting Analytics, all metrics listed in the selection panel that require Analytics show an “Analytics is disconnected, no data to show” message. Additionally, any metric listed in the selection panel that requires Analytics and was not already pre-selected is not selectable until Analytics is re-connected. |
| Locations | Top countries where visitors discovered your site. If there are more than five countries, they are grouped in the “Others” slice. You can see the full list of countries by following the link to the detailed Google Analytics report. |
| Devices | Devices people were using when they visited your site: desktop, mobile, or tablet. |
When you select a slice in the right pie chart, this line graph will change to show how your site did over time for that particular type of traffic.

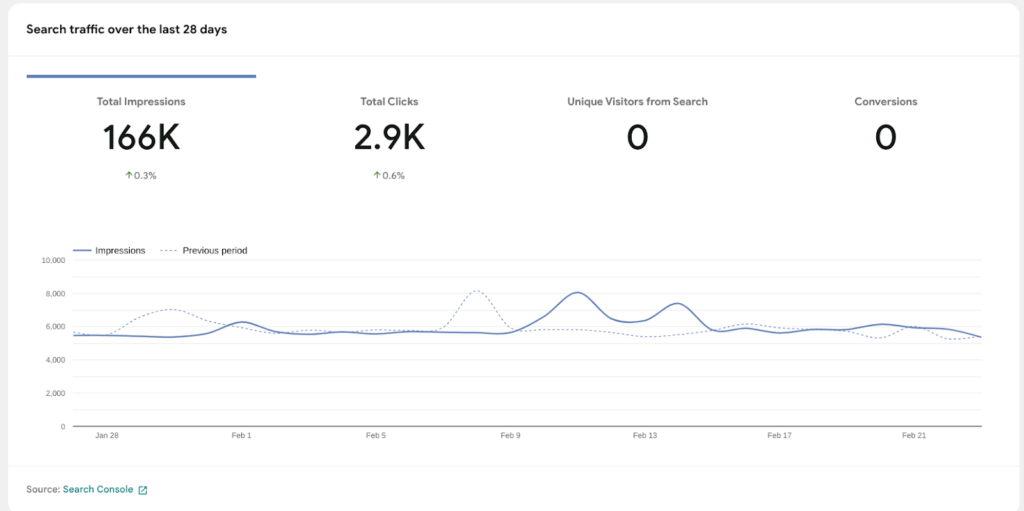
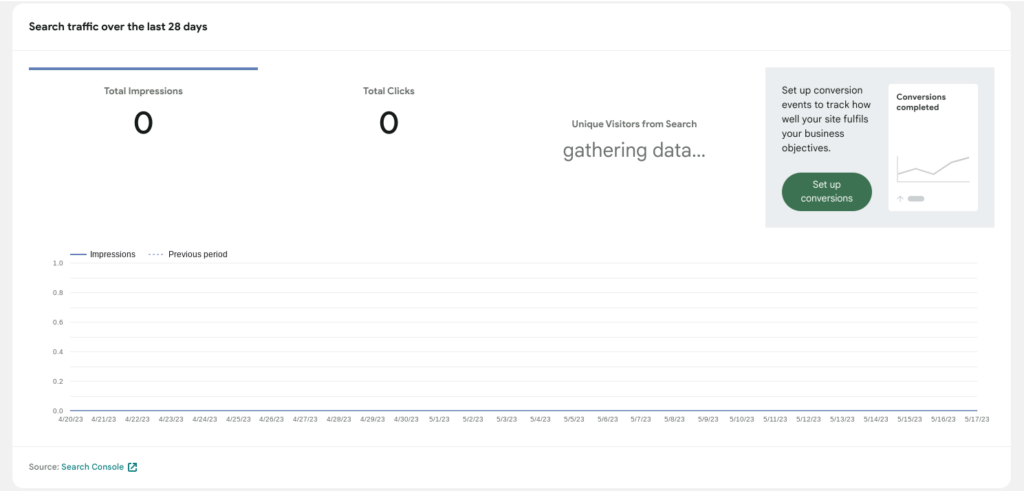
The search traffic section shows your site’s impressions, clicks, and unique visitors from Search and conversions. These are defined as:
| Total Impressions | How many people saw your site in Google Search results. Learn more about impressions and clicks. |
| Total Clicks | How many people clicked a link to your site in Google Search results. Learn more about impressions and clicks. |
| Unique Visitors from Search | How many people found your site on Google Search and had a session on your site. If a visitor comes to your site more than once in a single session, it counts as the same visitor, which makes this data unique. This data comes from Analytics. |
| Conversions | Any user action that’s valuable to your business; for example, a user purchasing from your store or subscribing to your newsletter are examples of common conversions. |
Clicking on Total Impressions, Total Clicks, Unique Visitors from Search, conversions or goals displays a chart that compares that metric for the defined period versus the previous period. For example, if you have chosen “last 28 days,” the previous period is the 28 days before the last 28 days.
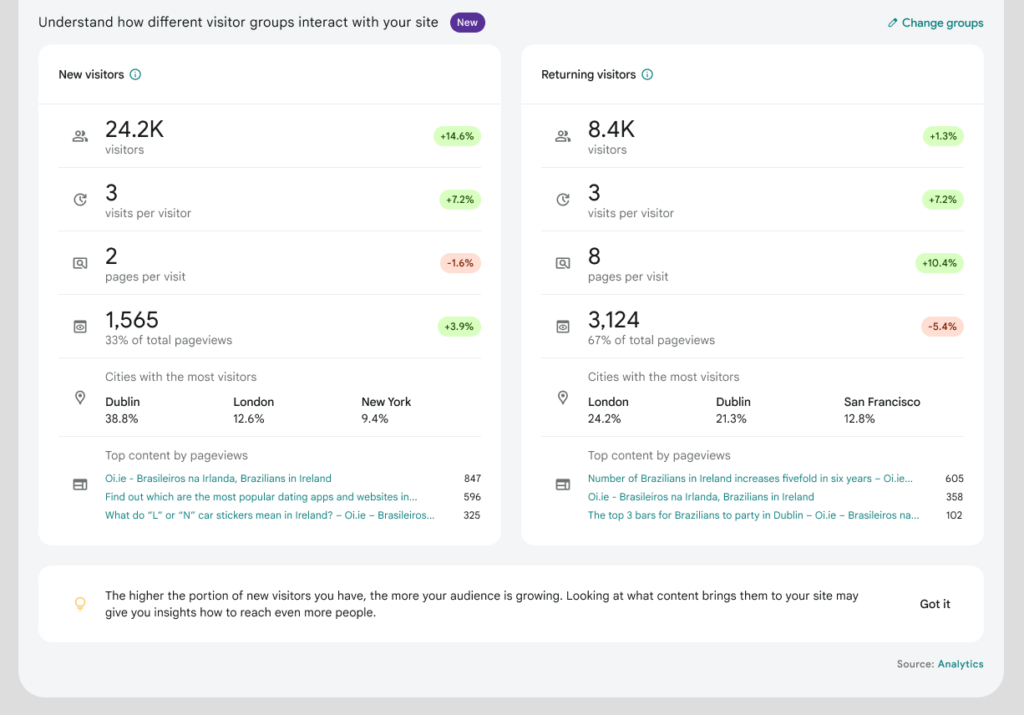
The tiles that you see below the Understand how different visitor groups interact with your site section display your visitor groups. Visitor groups are not displayed by default. See our visitor groups guide for more information.

Site goals
This section provides a clear summary of how a site is achieving business objectives, such as driving online store sales or capturing leads, by automatically setting up events and directly surfacing conversion data within the Site Kit dashboard.

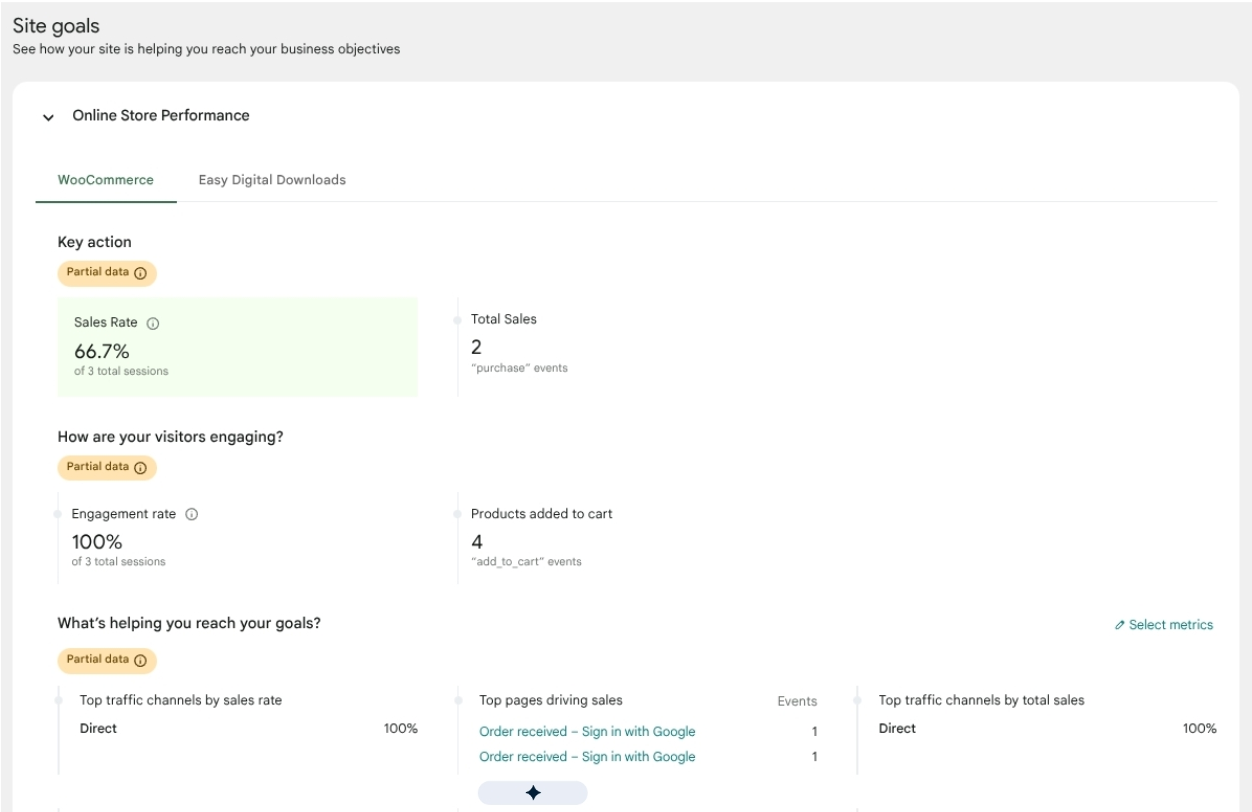
Learn more about site goals.
Content
The Content section helps you keep track of your most popular pages and how people found them from Search.

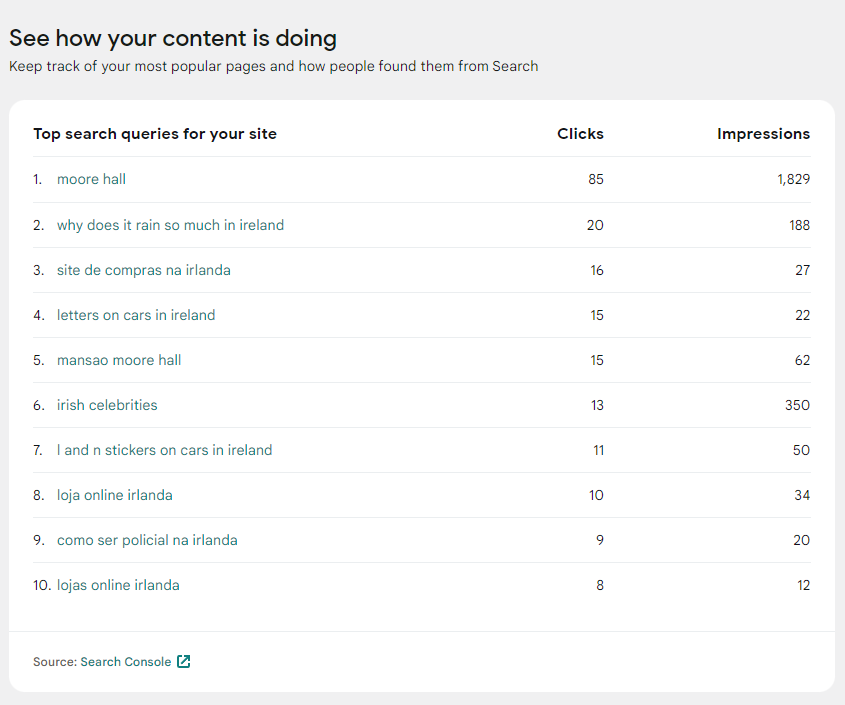
This panel shows the top search queries that led to your site during the time period selected from the calendar dropdown based on Search Console data.

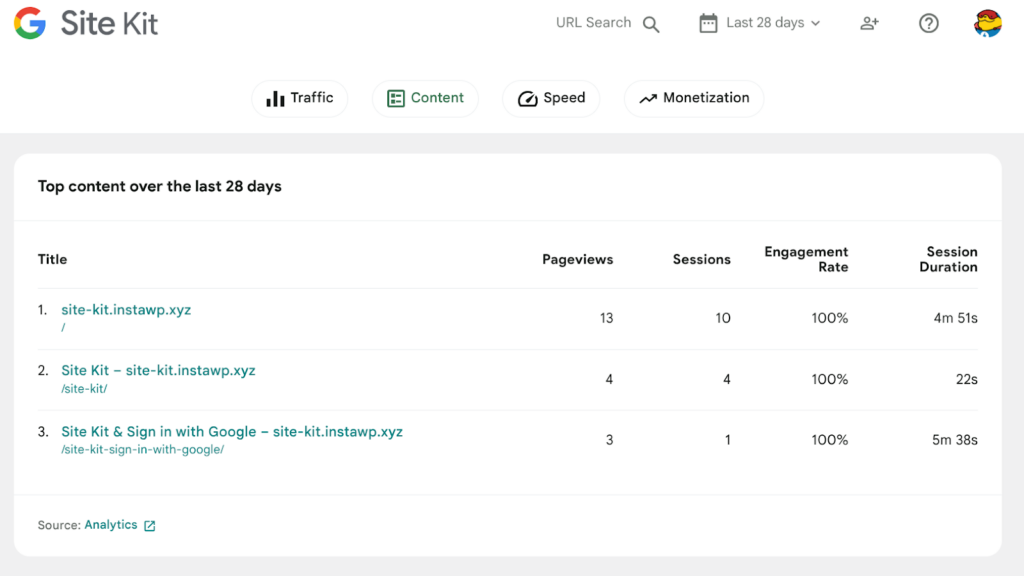
The top content panel shows your site’s most popular content during the time period selected from the calendar dropdown based on Analytics data, including pageviews, sessions, engagement rate, and session duration.
Speed
The Speed section uses data from PageSpeed Insights to show you how fast your homepage is.

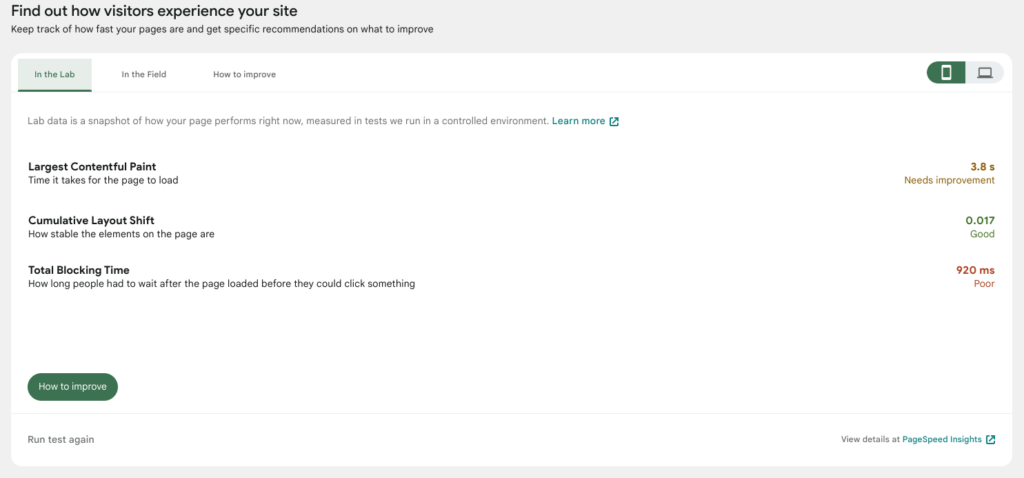
The recommendations include possible next steps for improving your homepage. Additional details on report results can be viewed by clicking the View details at PageSpeed Insights link at the bottom right of the panel. The how to improve tab provides a list of suggestions on how to improve the speed of your site.
Monetization

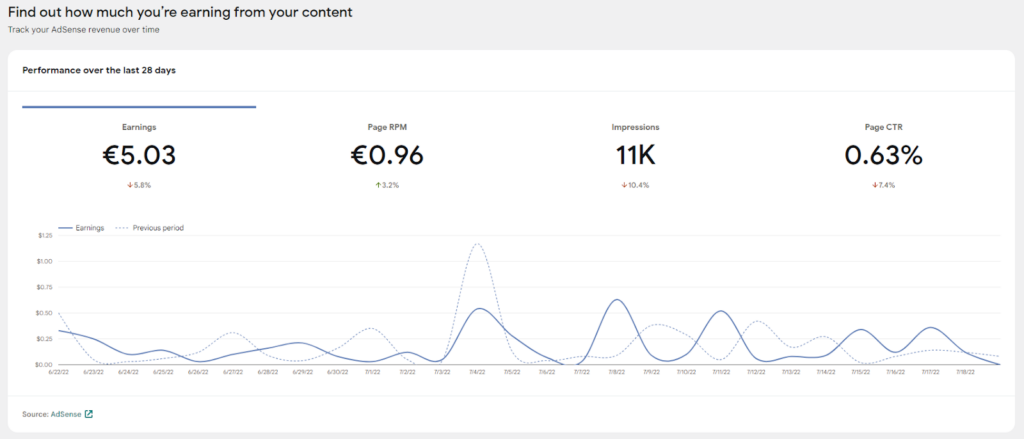

If AdSense is connected via Site Kit, the Monetization section shows metrics for your ads during the time period selected from the calendar dropdown, including:
| Earnings | Your earnings based on ad activity |
| RPM | Earnings per thousand pageviews |
| Impressions | Number of ads shown on your site |
| Page CTR | The clickthrough rate for ads shown on your site |
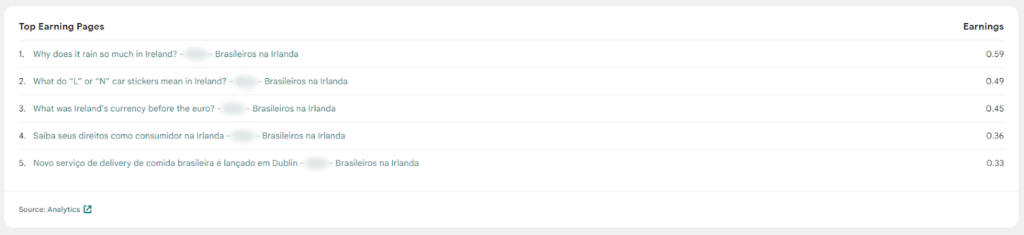
Top earning pages
The top earning pages section displays a summary of the top earning pages on your site. It only displays stats if your Analytics and AdSense accounts are linked.
After linking the two accounts via your AdSense account, there is a brief period when data is being gathered without any visible metrics. Top earning pages data is only available from the time you connect Analytics and AdSense.
If you have connected Analytics and AdSense in Site Kit but those accounts are not linked, you are prompted on the Site Kit dashboard to link them.
You are also able to link the accounts by clicking on the Learn more link on the notification widget in the Monetization section of the dashboard.
Once you have linked your Analytics and AdSense accounts, it takes up to a day for Site Kit to detect they are linked and start gathering data. Site Kit displays a success banner once it detects the accounts are linked.
After a brief period gathering data, you see a notification on your dashboard to notify you that your top earning pages data is ready to view. Click on the Show me button to be taken to the summary. You can still view the data any time from the Monetization section of your dashboard if you chose the Maybe later option.
You are also able to view this data in the top earning content key metric tile. Find more information in the key metrics guide.
Gathering data
The gathering data… notification and dashboard widget messages display when data is still being collected in the appropriate Google service (Analytics, Search Console, etc.) to be displayed in the Site Kit dashboard. If you created a new account for the relevant Google service during Site Kit setup, it may take up to 48 hours for data to be collected and begin displaying in the dashboard.
Not enough traffic yet to display stats
The Not enough traffic yet to display stats notification appears at the top of the dashboard when your site has not yet received enough traffic for stats to be generated and displayed in the dashboard (for example, if the site was only recently created). If this is the case, zeroes also display in the Traffic and Content section widgets. Note that once your website does have enough traffic for reporting, it can take 24-48 hours for traffic to begin displaying in the Site Kit dashboard.